
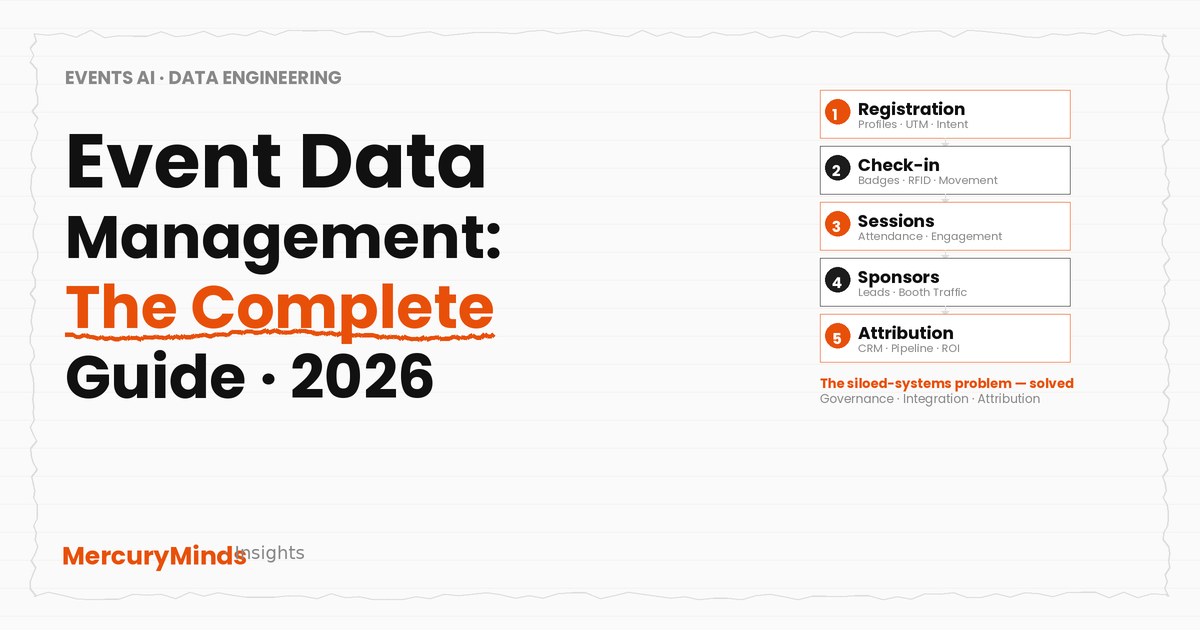
Event Data Management: The Complete Guide (2026)
Event data management is the practice of systematically collecting, integrating, governing, and activating data generated across the full event lifecycle — from initial registration through post-event revenue attribution. Most event organisations already collect more data than they use. The problem is not data volume. It is data fragmentation: registration data in one system, badge scan data in another, session tracking in a third, sponsor leads in a fourth, and post-event outcomes in a spreadsheet that nobody reconciles. Solving that fragmentation — building a unified event data infrastructure — is what transforms event data from a reporting burden into a business asset.
The global event management software market sat at approximately $9–9.9 billion in 2025 and is forecast to grow toward $16–17 billion by 2030, driven by the increasing demand for data-driven event programmes, AI-powered personalisation, and measurable sponsor ROI. The growth is not in the events themselves — it is in the intelligence layer that makes events provably valuable. Event organisers who build that layer retain sponsors at higher rates, improve attendee experience systematically, and generate more pipeline per event dollar. Those who do not increasingly struggle to justify their budget in a marketing environment where every channel faces accountability.
This guide maps the complete event data lifecycle, names the siloed-systems failure patterns that prevent most organisations from using the data they already collect, establishes the governance framework that makes data trustworthy, and explains the integration architecture that connects the dots. It is written for event operations leads and data engineers responsible for making event programmes measurable — not for first-time event planners looking for tool recommendations.
The Event Data Lifecycle: Five Stages
Event data is not a single data set. It is a series of overlapping data streams that accumulate across five distinct lifecycle stages, each generating different data types with different latency, structure, and activation potential. Understanding the lifecycle is the prerequisite for designing a unified data architecture — because you cannot build integration logic without knowing what data is generated when, and in what format.
Registration and pre-event data
Registration is where the event's data foundation is either built correctly or broken. Every attendee record created at registration will flow through every subsequent system — badge printing, session check-in, app personalisation, lead retrieval, and post-event CRM attribution. The structural decisions made at registration time determine the quality of every downstream data output.
Well-structured registration data includes: a unique attendee identifier (not just name — a persistent ID that links the same person across all event systems); company name in a standardised format (not free-text — a controlled list or enrichment step to prevent the same company appearing as "Acme Corp," "ACME," and "Acme Corporation" as three separate entities); role and seniority (job title, function, seniority tier); session preferences and intent data (which topics are they most interested in, which sessions have they pre-registered for); and UTM source and channel attribution (how did they find the event — so marketing investment can be tracked back to registration outcomes).
The most consequential failure at this stage: free-text company name fields with no normalisation. A company that appears with 12 different spellings across your CRM is 12 separate records, not one account. Every downstream analysis that tries to correlate event attendance with CRM pipeline will fail because the records cannot be matched. Data quality at registration is not a technical nicety — it is the condition on which all other event data value depends.
Check-in and badge data
Check-in is the first operational data capture point of the event itself. It generates the definitive attended-vs-registered dataset — the show-up record — and, for events using RFID or NFC badge technology, the beginning of the movement data stream that tracks where attendees go throughout the venue.
QR-code-based check-in (using the registration system's barcode on a printed or digital ticket) is the minimum viable check-in infrastructure. It validates attendance, records arrival time, and triggers badge printing (for on-demand badge printing setups). The data it generates is binary: attended or did not attend, with a timestamp. This is sufficient for most events up to a few hundred attendees.
RFID and NFC smart badge technology (Klik SmartBadge and similar systems) generates continuous movement data: which zones of the venue each attendee visited, when, and for how long. This data powers sponsor booth analytics (who visited which booth and for how long), session attendance verification (who was actually in the room versus who registered for the session), and networking interaction logs (two NFC-enabled badges that were held near each other for a defined duration are recorded as an interaction). The richer the badge technology, the richer the data — but also the greater the GDPR compliance obligation for European events, where movement tracking data is personal data requiring explicit consent.
Session engagement data
Session data is the most underutilised layer in event data management. Most organisers record which sessions ran and roughly how many people attended. Very few can answer the more valuable questions: which specific accounts (companies) were in the room for which sessions? How does session-level engagement correlate with post-event conversion to pipeline? Which sessions had the highest early exit rate, and what does that signal about content quality?
Session engagement data has two components. Attendance data: who was in the room (from session check-in scans or RFID), at what time, for how long (dwell time tracks whether they stayed for the full session or left after 10 minutes). Interaction data: who asked questions (linked to their attendee profile if they used an event app Q&A feature), who completed in-session polls or surveys, who downloaded session materials, who connected with the speaker through the event app.
The intersection of session attendance and company profile data is where the most commercially valuable insights emerge. An organiser who can show a sponsor that 47% of the attendees for the "Enterprise Procurement in 2026" session were heads of procurement or VP-level supply chain executives from companies with over 500 employees is providing concrete evidence of audience quality — the kind of evidence that justifies package renewals and price increases. Without session-level data linked to attendee profiles, that conversation defaults to headline attendance numbers that sophisticated sponsors increasingly discount.
Sponsor and exhibitor interaction data
Sponsor and exhibitor data is the highest-stakes data layer from a revenue retention perspective. Sponsors who cannot measure the value of their participation cancel or reduce their commitment. Sponsors who can see verifiable ROI data — qualified lead count, audience match score, cost per qualified lead, pipeline influenced — renew at higher rates and expand their package investment. The data infrastructure that produces that verification is the commercial moat that differentiates one event from its competitors.
Sponsor interaction data comes from three sources. Lead retrieval data: the lead capture app records used by exhibitors at their booths — each scan of an attendee badge generates a contact record linked to the attendee's profile, with any qualification fields the exhibitor's team added. Booth traffic data: from RFID/NFC badge systems, the volume and dwell time of attendees who entered each exhibitor's booth zone. Sponsor activation data: engagement with sponsor-branded sessions, digital activations (sponsored content downloads, demo sign-ups, product interactions), and push notification responses.
The critical integration requirement at this stage: sponsor lead retrieval data must be linkable to attendee profiles from the registration system. If the lead retrieval app creates isolated records that cannot be matched back to the central attendee database, you cannot calculate Audience Match Score (the proportion of the sponsor's leads whose profile matches their ICP) — and that is the metric that increasingly determines renewal decisions. Many event platforms have lead retrieval as an add-on that does not natively integrate with the core attendee database. This is one of the most common integration gaps in event data architecture.
Post-event attribution data
Post-event data is where the entire data lifecycle either proves its value or dissolves into a pile of metrics that nobody acts on. The critical distinction: post-event data management is not producing a summary report. It is closing the loop between event participation and business outcomes — connecting the contacts generated during the event to the revenue they influenced, and presenting that connection in a format that stakeholders can use to make investment decisions.
Post-event attribution requires three data flows. CRM integration: event leads must be matched to CRM account and contact records (by company domain, email address, or a unique identifier established at registration), tagged with the event source, and tracked for pipeline creation within defined attribution windows (typically 30, 60, and 90 days). Marketing automation: post-event email sequences must be tracked by the attendee segment that received them (hot leads receive different sequences than warm leads, which receive different sequences than cold contacts), and engagement data from those sequences feeds back into the lead scoring. Revenue attribution: deals that close within the attribution window and involve an event-sourced contact should be flagged for influenced revenue reporting — enabling the calculation of event-attributed revenue versus event investment.
The systemic failure at this stage: 54% of marketers are not tracking event registrations as part of their ROI metrics (Cvent 2026 Event Statistics Report). If the event-to-CRM data pipeline does not exist, no amount of on-event data quality will produce a measurable ROI figure. The post-event attribution step is the one most consistently missing — and it is the one that makes every other investment in event data management commercially justifiable.
The Siloed-Systems Problem
The single most important concept in event data management is the siloed-systems problem — because it explains why most organisations collect event data but cannot use it. Understanding the failure pattern is the prerequisite for designing a solution.
A typical mid-market event organisation runs the following stack:
Registration platform
Eventbrite, Cvent, or Swoogo — attendee profiles and ticket records
Badge / check-in system
fielddrive, Eventdrive, or show-provided badge system — movement and attendance data
Event app
Whova, Bizzabo, or Swapcard — session engagement and networking data
Lead retrieval
iCapture, Connexme, or show-provided scanner — exhibitor lead capture data
Each system holds accurate, complete data within its scope. But the crucial question — "what was the journey of a specific attendee from Company X, from registration through session attendance, booth visits, and post-event pipeline?" — cannot be answered by any single system, and answering it by manually merging exports from four systems is a multi-day project that most teams do not have time to run consistently.
Three specific failures emerge from this architecture:
Failure 1: Broken data chains on event day
When the badge printing system cannot directly read the registration platform's attendee records (because the data lives in different systems), someone has to export a CSV from the registration platform and import it to the badge printer. If a new registration arrives after the export, their badge cannot be printed without another manual export. If a name correction is needed, it requires a manual update in both systems. Every CSV export is a potential data integrity failure — duplicate records, encoding errors, mismatched fields, stale data. The more systems in the stack, the more CSV exports, the more failure points.
The consequence on event day: an attendee arrives whose badge cannot be printed because they registered after the last export. The check-in queue backs up. Staff are on the phone with the registration platform trying to manually look up records. The attendee experience is damaged, and the data for that attendee is incomplete or missing entirely. This is not a rare edge case. It is a predictable consequence of a fragmented data architecture — and it happens at most events that have not solved the integration problem.
Failure 2: Post-event reconciliation takes too long
After the event closes, the team needs to merge data from registration, badge scanning, session attendance, lead retrieval, and post-event surveys to produce sponsor reports, attendee follow-up lists, and ROI summaries. Without integration infrastructure, this is a manual Excel project. Each system exports its data in a different format. Company names do not match. Email addresses do not match. Some attendees appear in the lead retrieval data but not the session attendance data (because they attended the networking lunch, not the sessions). Reconciling all of this manually takes days — by which time the optimal follow-up window has passed, sponsor reporting is delayed, and the insights are stale.
The business cost: slow follow-up is the single biggest conversion killer in event lead management. Follow-up emails within 24 hours achieve a 48% open rate; the same emails sent a week later achieve 21% (Mailchimp and Exhibitor Magazine data, cited in our trade show lead scoring guide). If reconciling your data takes a week, your entire lead follow-up programme is operating in the half-engagement zone by default.
Failure 3: No longitudinal view across events
For organisations running a series of events — annual conferences, regional roadshows, quarterly user groups — the most valuable data asset is longitudinal: how the same attendees and companies behave across multiple events over time. Which accounts have attended every year? Which are declining in engagement? Which sponsors are generating better Audience Match Scores than they were two years ago?
Answering these questions requires a persistent data store that aggregates event records across every edition of the event series, linked by a consistent identifier (typically company domain and email address). Without this infrastructure, every event is an island — the data from each edition exists somewhere, but it cannot be compared with or combined with the data from previous editions. Longitudinal analysis is simply not possible. For event organisers selling multi-year sponsorships or trying to demonstrate the strategic value of their event programme to a parent organisation, this is a significant competitive and commercial handicap.
Solving the Siloed-Systems Problem: Three Architectural Approaches
Approach 1: Unified event management platform
The cleanest solution is a single platform that handles all lifecycle stages in one system — registration, check-in, session tracking, event app, lead retrieval, and post-event analytics all connected to a single attendee record. Bizzabo, Cvent, RainFocus, Swapcard, and similar enterprise platforms offer this model. The advantage: no integration required. Data flows through one system, attendee records are persistent and consistent, and reports can draw on all lifecycle stages simultaneously.
The limitation: no single platform does everything perfectly. Enterprise event platforms typically excel in one or two areas and are competent but not best-in-class in others. An organiser who uses Bizzabo for everything may find that its badge technology is less capable than a dedicated badge provider, or that its lead retrieval app is less flexible than a specialist tool. The trade-off is integration simplicity versus point-solution depth. For most mid-market organisations, the integration simplicity is worth the compromise on individual feature depth.
Approach 2: Integration middleware layer
For organisations that need best-in-class point solutions at each lifecycle stage, an integration middleware layer connects them — routing data in near-real-time between systems, normalising data formats, and writing all records to a central data store. Integration platforms like Zapier (for simple, low-volume connections), Make, Celigo, and MuleSoft (for enterprise-grade, high-volume integrations) can connect event platforms that do not have native integrations with each other.
The critical design principles for event middleware: the integration must be bidirectional (changes in the registration system should propagate to the badge system and vice versa); it must operate in near-real-time (batch exports that run every 24 hours are not sufficient for event-day operations where walk-in registrations happen continuously); it must have clear error handling (if a sync fails, the team needs to know immediately and the failure must be recoverable); and it must write to a persistent central store (an integration that just moves data between point solutions without writing to a warehouse cannot support longitudinal analysis).
Approach 3: Event data warehouse
For organisations running large-scale multi-event programmes where longitudinal analysis and sponsor-level reporting are strategic priorities, the appropriate architecture is an event data warehouse. Raw data from all event systems — registration, badge, session, lead retrieval, surveys — is extracted, transformed, and loaded into a central warehouse (Snowflake, BigQuery, Redshift, or Databricks), where it is structured into a consistent data model that enables cross-event, cross-system analysis.
The data warehouse approach is the most powerful but also the most expensive to build and maintain. It requires: ETL pipelines from each source system; a defined event data model (what entities exist, how they relate, what identifiers link them); data quality and validation logic; and a BI or reporting layer (Tableau, Looker, Metabase, or Power BI) for querying and visualising the data. For a single annual conference, this investment is unlikely to be justified. For a programme of 20+ events per year with significant sponsor revenue at stake, the warehouse approach is the only architecture that can support the analysis complexity needed.
MercuryMinds builds event data warehouses for organisers managing multi-event programmes — connecting source systems, building the data model, and deploying the reporting layer. Our event data collection practice covers the full infrastructure stack from source to insight.
Data Governance: The Non-Negotiable Foundation
Data governance is the set of policies, standards, and processes that determine how event data is collected, structured, stored, accessed, and eventually deleted. Without governance, even a well-integrated technical architecture produces untrustworthy data — because different events use different data definitions, different field formats, and different collection standards, making cross-event comparison impossible and compliance exposure real.
Governance must be established before registration opens
The most common governance mistake is treating it as a post-event problem — addressing data quality and compliance after the event has closed and the data has been collected. By then, it is too late to fix structural problems. If the registration form asked for "job title" as a free-text field rather than a controlled list, you now have 847 different job titles for 1,200 attendees, making seniority segmentation impossible. If the event app did not have a Data Processing Agreement in place with the organiser before the event, you may be in GDPR breach. Governance is a pre-event design decision, not a post-event cleaning task.
The five governance pillars for event data
Data definitions and field standards
Define, document, and enforce standard field formats across all event systems. Company name is a controlled field with normalisation (not free text). Job title maps to a defined seniority taxonomy. Country codes use ISO 3166-1 alpha-2. Session IDs are consistent across the registration system, event app, and session check-in scanner. Email addresses are lowercased and validated at point of entry. These decisions, made before registration opens, determine whether you can run cross-system analysis after the event. Changing them after registration is open is costly and error-prone.
Unique attendee identifier strategy
Every attendee needs a persistent unique identifier that follows them across all event systems — from registration to badge to session to lead retrieval to CRM. Email address works for most use cases but has limitations (people use different emails for work and personal registrations; email addresses change over time). A registration-generated UUID (universally unique identifier) encoded in the badge QR code is more reliable — it links all event systems to the same record without depending on the attendee spelling their email consistently in different contexts.
GDPR and privacy compliance
For European events (and events with European attendees), data governance includes the legal compliance layer: lawful basis for processing attendee data (consent or legitimate interest, depending on how the data will be used); Data Processing Agreements with every third-party platform that processes attendee data; explicit consent collection for RFID/NFC movement tracking (which is sensitive personal data under GDPR); data retention policies (how long will attendee data be kept, and for what purpose); and a defined process for responding to subject access requests within 30 days. Governance documentation should be prepared before the registration form goes live — because the form is where consent is collected.
Data access controls
Define who has access to which data, at what level of granularity, and for what purpose. Sponsors should receive aggregated or anonymised engagement data for their booth and sessions — not the full attendee list. Staff should have access to the data they need to do their job, not full admin access to the entire event dataset. Post-event, access to raw attendee data should be restricted to defined roles, with an audit log of who accessed what. Access control is both a governance and a compliance requirement — and it is routinely under-specified in event data management plans.
Data retention and deletion schedule
Event attendee data cannot be retained indefinitely under GDPR (and increasingly under CCPA and similar regulations). Define the retention schedule before the event: raw attendee records are retained for X months post-event for follow-up purposes; aggregate engagement data is retained indefinitely for programme improvement; CRM records follow the CRM's own retention policy (governed separately). Automated deletion or anonymisation workflows should execute at the defined schedule — not be triggered manually when someone remembers to do it. Retention schedules that exist only in a document and are never automated are compliance theatre, not compliance.
The AI Layer: What Matters in 2026
Artificial intelligence is changing event data management in three practical areas where production-ready capability exists in 2026. These are not aspirational — they are operational features deployed by leading event organisations.
AI-powered registration and personalisation
Dynamic, conversational registration flows — where AI asks follow-up questions based on initial answers rather than presenting a static form — are converting at more than double the rate of static registration forms (Bizzabo 2026 benchmark data). More importantly, they capture richer intent data: what the attendee hopes to get from the event, which topics are most relevant to their current priorities, which types of connections would be most valuable. This intent data feeds personalised session recommendations, personalised matchmaking suggestions, and personalised sponsor matching — connecting attendees with the exhibitors most relevant to their declared interests rather than routing everyone to the same booths.
Real-time AI analytics during the event
AI-powered live dashboards that synthesise data from check-in, session attendance, and booth traffic in real time — and surface actionable alerts — are now standard in enterprise event management platforms. Concrete capabilities: alerting operations staff when a session room reaches 90% capacity before it reaches 100% (enabling real-time redirection to overflow rooms); identifying attendee flow bottlenecks at peak entry times; and surfacing which sponsor booths are underperforming their expected traffic (enabling the organiser to take active steps to drive more traffic during the event rather than reporting the underperformance after it is too late to fix).
The critical enabler for real-time AI analytics is real-time data pipelines. An event platform that runs batch data updates every hour cannot support real-time operational decisions. The architecture decision — real-time streaming data versus hourly batch — is made before the event and determines what operational intelligence is possible during it. For events where sponsor ROI is a primary commercial driver, real-time data is not a premium feature; it is an operational requirement.
Automated post-event reporting
AI-generated sponsor ROI reports — using the unified data from across the event lifecycle to auto-generate KPI summaries, year-over-year comparisons, audience match analysis, and qualified lead counts — are reducing post-event reporting time from days to hours. The output still requires human review and narrative framing, but the data aggregation and initial analysis that previously consumed the bulk of reporting time can now be automated. For organisations running multiple events per year with dozens of sponsors, this is a significant productivity gain and a qualitative improvement in reporting speed — which itself drives better sponsor relationships.
50% of event professionals plan to use AI throughout the meetings journey in 2026, according to the Amex GBT 2026 Global Meetings & Events Forecast — from ideation and agenda-building through engagement tracking and post-event evaluation. The adoption is broad and accelerating. Organisations building AI capability into their event data infrastructure now are building a compounding advantage: more data generates better AI outputs, which generate better events, which generate more data.
Building a Data-Driven Event Programme: The Maturity Model
Event data management is not a binary capability — you either have it or you do not. It is a maturity curve that most organisations move through over two to four years of deliberate investment. Understanding where your programme currently sits helps prioritise the next investment.
| Maturity level | Characteristics | Primary gaps | Next investment |
|---|---|---|---|
| Level 1 — Collection | Events run. Data exists in multiple separate systems. Some post-event reporting done manually. No cross-system analysis. | Integration. Data quality. No unified view. | Standardise data fields. Choose a primary event platform. Map the integration gaps. |
| Level 2 — Integration | Core systems (registration, check-in, session, lead retrieval) are connected or unified. Data can be queried across lifecycle stages. Manual reporting still required but faster. | Post-event CRM attribution. Longitudinal analysis. Sponsor ROI verification. | Build CRM integration. Establish attribution windows. Define sponsor reporting framework. |
| Level 3 — Attribution | Event leads flow to CRM automatically. Pipeline attribution is tracked within defined windows. Sponsor ROI reports include verifiable lead and pipeline data. | Longitudinal analysis across events. Predictive planning. Real-time operational intelligence. | Build event data warehouse. Enable year-over-year analysis. Implement real-time dashboards. |
| Level 4 — Intelligence | Unified data warehouse across all events. Longitudinal analysis enables trend identification. AI-powered personalisation. Real-time operational dashboards. Predictive capacity planning. | AI-powered sponsor matching. Automated renewal pricing. Predictive audience modelling. | AI layer for personalisation, reporting automation, and predictive analytics. |
Metrics That Actually Matter
Most event measurement frameworks track the wrong things — or track the right things without connecting them to business outcomes. Here is the distinction between vanity metrics (common but commercially uninformative) and signal metrics (less common but directly tied to event programme value).
| Vanity metric | Why it is insufficient | Signal metric | Why it matters |
|---|---|---|---|
| Total attendance | Does not distinguish between your target buyers and everyone else | ICP attendee rate | What % of attendees match your (or your sponsors') ideal buyer profile? |
| Total badge scans per exhibitor | Includes giveaway-seekers; no indication of purchase intent | Qualified lead count per exhibitor | Leads meeting a defined BANT score threshold — the metric sponsors act on |
| Session fill rate | A full room of the wrong people is not success | Target account session attendance rate | What % of target-account attendees attended which sessions? |
| Post-event survey score | Satisfaction ≠ ROI; happy attendees do not always become pipeline | Event-influenced pipeline within 90 days | Pipeline created from event contacts — the metric that justifies the event budget |
| Email open rate (post-event) | Open rate without conversion data is incomplete | Meeting booked rate from event contacts | What % of event contacts accepted a follow-up meeting? |
| Social media impressions | Reach without intent; impossible to attribute to pipeline | Cost per qualified lead (event total cost ÷ qualified leads) | Enables comparison with other demand generation channels |
Limitations of This Guide
- Market size figures (event management software $9–9.9B in 2025, forecast $16–17B by 2030) are from Grand View Research and Fortune Business Insights via the Guideflow blog (June 2026). These are market research estimates with standard methodology limitations — treat as directional rather than precise.
- The "54% of marketers not tracking event registrations as ROI metric" statistic is from the Cvent 2026 Event Statistics Report, cited by SquadUP (May 2026). Verify against the primary Cvent report for the specific question wording and sample methodology.
- GDPR requirements described are general principles. Specific compliance obligations depend on event geography, attendee geography, data categories collected, and purposes of processing. Consult legal counsel for your specific event context before relying on any data collection or processing approach described here.
- Platform recommendations are excluded from this guide intentionally — the right platform depends on event size, format, integration requirements, and budget, and the market changes rapidly. The architecture patterns described are platform-agnostic; any reputable event management platform can support them if properly configured and integrated.
Building a unified event data infrastructure for your programme?
MercuryMinds engineers event data collection systems, integration pipelines, and data warehouses for event organisers running multi-event programmes. We connect your source systems, build the data model, and deploy the reporting layer — so your team can answer the questions that matter without a week of manual reconciliation after every event.
Talk to the TeamFrequently Asked Questions
What is event data management?
Event data management is the practice of systematically collecting, integrating, storing, governing, and activating the data generated across the full event lifecycle — from initial registration through post-event attribution. It encompasses five data layers: registration and attendee profile data, on-site check-in and movement data, session attendance and engagement data, sponsor and exhibitor interaction data, and post-event outcome data including CRM-linked pipeline attribution. The primary challenge is not data volume but data fragmentation: most event organisations run multiple disconnected systems for different lifecycle stages, meaning no single unified view of attendee behaviour or event ROI exists. Effective event data management connects these systems, establishes data governance standards, and activates the resulting dataset for sponsor reporting, attendee personalisation, and event programme improvement.
What data does an event generate?
A single in-person event generates data across five categories. Registration data: attendee profiles, ticket type, payment records, UTM source, and pre-event survey responses. Check-in and movement data: arrival timestamps, badge scan logs, and RFID or NFC movement records tracking booth visits and session attendance. Session engagement data: which sessions each attendee attended, for how long, and whether they asked questions or downloaded materials. Sponsor and exhibitor data: leads captured per booth, booth dwell time from badge tracking, meeting requests, and digital activation engagements. Post-event data: survey responses, email sequence engagement, CRM pipeline created from event contacts, deals influenced, and revenue attributed within 30, 60, and 90-day windows.
What is the siloed-systems problem in event data?
The siloed-systems problem is the most common cause of event data failure: registration data lives in one platform, badge scan data in another, session check-in data in a third, sponsor lead retrieval in a fourth, and post-event surveys in a spreadsheet. Each system has accurate data within its scope, but no unified view of a single attendee's journey exists — making it impossible to answer questions like which attendees from target accounts visited which sponsor booths and then appeared in the pipeline, without manual data merging that is too slow and error-prone to be operationally useful. The solution is either a unified event management platform that handles all lifecycle stages in a single system, or an integration layer that connects point solutions and routes data to a central data warehouse in real time.
How do you measure event ROI with data?
Measuring event ROI requires connecting four data streams that most organisations keep separate. First, event cost data: total investment including venue, production, marketing, and staff time. Second, lead and engagement data from the event: attendee interactions with sponsors, sessions attended, leads captured, and conversations had. Third, CRM attribution: matching event leads to CRM records and tracking which became pipeline opportunities, at what value, within defined post-event windows of 30, 60, and 90 days. Fourth, revenue data: closed revenue attributed to event-sourced opportunities. The ROI calculation is event-influenced revenue divided by total event investment. The challenge is the integration — 54 percent of marketers are not tracking event registrations as part of their ROI metrics, which means the CRM attribution step is missing and ROI cannot be calculated.
What data governance is needed for event data under GDPR?
Event data governance under GDPR requires addressing five specific requirements. Lawful basis: event registration data requires either explicit consent or legitimate interest as the lawful basis for processing. Data minimisation: only collect data necessary for the stated purpose. Data subject rights: attendees have the right to access, correct, and delete their personal data, and systems must respond within 30 days. Retention limits: define how long attendee data will be retained and for what purpose. Third-party processors: every platform that processes attendee data must have a Data Processing Agreement in place. Badge movement tracking data from RFID or NFC systems is sensitive personal data; consent must be specific and informed before collection begins.