
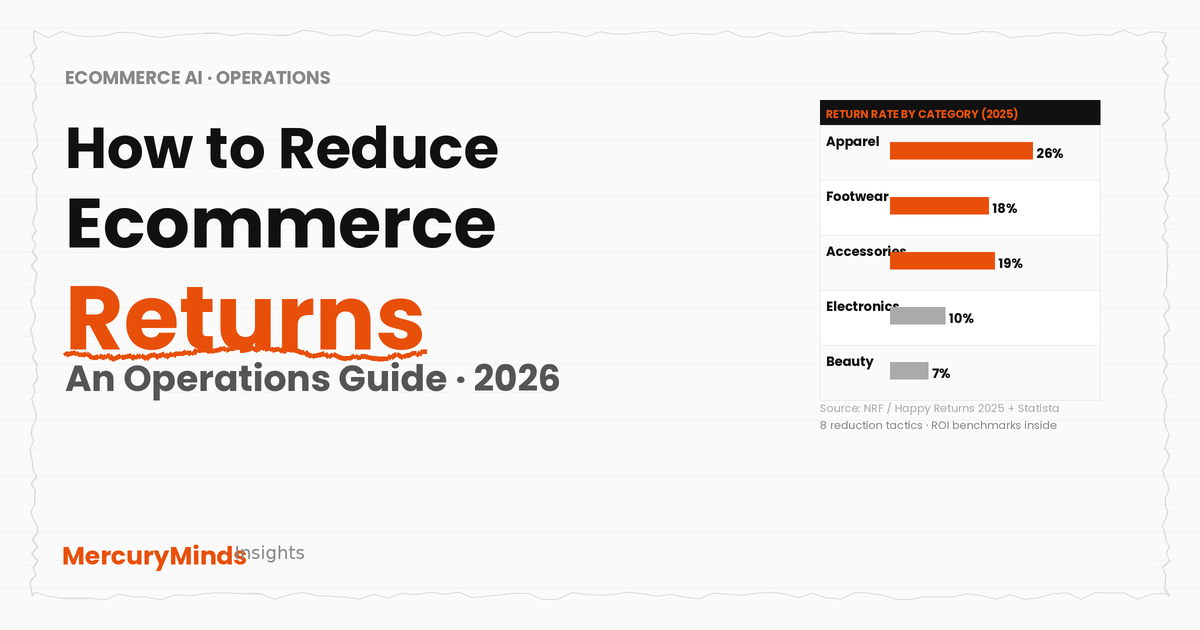
How to Reduce Ecommerce Returns: An Operations Guide (2026)
The scale of the problem: Online returns cost U.S. retailers $849.9 billion in 2025. The ecommerce return rate is approximately 19–20%, more than double the in-store rate of 8–9%. About 45% of all returns trace to size, fit, or colour mismatch — expectation gaps that can be closed before the customer checks out. This guide covers the benchmark data, the root causes by category, and eight documented tactics for reducing return rates, each with an ROI estimate grounded in published data.
Returns are the largest avoidable cost centre in ecommerce. For an Ops Lead managing fulfilment, they consume warehouse space, staff time, carrier budget, and margin on resale. For the P&L, a single percentage-point reduction in return rate on a $10 million business saves approximately $140,000 in avoided processing costs and retained revenue. And yet, most returns reduction programmes stop at "improve your product descriptions" — which is necessary but not sufficient.
This guide is built for operations leads and ecommerce directors who want to move beyond general advice to specific, quantified tactics. All return rate statistics are sourced from the NRF / Happy Returns 2025 Retail Returns Landscape report (October 2025), the most current industry benchmark available heading into 2026. Where tactic-level reduction claims are cited, the source and its reliability are noted explicitly — because vendor-stated figures in this space range from the credible to the implausible, and you need to know which is which before building a business case.
The Benchmark Data: Where Your Return Rate Should Sit
Before building a reduction programme, establish your baseline against category-appropriate benchmarks. The blended 19–20% ecommerce average is almost meaningless as an operational target because return rates are overwhelmingly a function of what you sell, not how you operate. A 15% return rate is excellent for an apparel brand and alarming for a beauty brand. A 30% rate is typical for fashion and catastrophic for electronics.
Source note on category rates: Different studies produce different figures for the same categories, because methodology (survey-based vs. transaction-based), geography (US vs. global), and retailer mix all affect outcomes. The ranges below are compiled from Statista consumer survey data (April 2024–March 2025, 9,778 US adults), Richpanel industry benchmark datasets (May 2026), and DigitalApplied research (May 2026). Where sources diverge, ranges are used rather than single figures. Use these as directional benchmarks; your own category rate from your own transaction data is always the relevant anchor.
| Category | Typical return rate range | Primary return cause | Benchmark interpretation |
|---|---|---|---|
| Apparel / clothing | 20–40% (avg ~26%) | Fit, size, colour misrepresentation | Highest-returning category; fit content investment has clearest ROI |
| Footwear | 17–30% (avg ~18%) | Fit and size; cannot try before buying | Width data and AI size tools materially reduce rates |
| Bags / accessories | 15–22% (avg ~19%) | Colour accuracy; scale/size misperception | Photography quality and colour-accurate imaging are primary levers |
| Consumer electronics | 8–15% | Compatibility issues; defects; buyer's remorse | Compatibility checkers and clear spec tables are key |
| Home goods / furniture | 10–20% | Dimension misperception; colour/material mismatch | 3D viewers and AR placement tools have strongest documented impact |
| Beauty / personal care | 4–12% | Shade mismatch; sensitivity/reaction | Shade-matching guidance and ingredient transparency reduce rates |
| Food / beverages | ~12% | Damage in transit; wrong item | Packaging quality and order accuracy are primary levers |
If your return rate sits meaningfully above the top of your category range, a specific operational or content problem is almost certainly driving it — a sizing run that shifted, a product description that consistently over-promises, a packaging issue causing damage in transit, or a specific SKU cluster generating disproportionate returns. The first diagnostic step before implementing any reduction tactic is a SKU-level returns audit: which products are generating what return rate, and what reasons are customers citing? Without this, you are guessing at root causes and spending reduction budget in the wrong places.
Root Causes: Why Customers Return
Consumer survey data from Statista (April 2024–March 2025) gives the top return reasons in order of frequency:
- Changed mind after purchase — 24% of returns. The most difficult to prevent through product content; most amenable to policy interventions (restocking fees, extended exchange periods to reduce impulse returns).
- Received the wrong item — 23% of returns. An operations failure, not a product content failure. The fix is order accuracy at pick-and-pack, barcode verification, and warehouse quality control — not PDP improvements.
- Item not as portrayed / described online — 22% of returns. This is the expectation gap — the gap between what the product page communicated and what the customer received. Directly addressable through PDP accuracy, photography quality, and fit content.
- Received damaged or defective item — 20% of returns. A packaging and carrier quality issue. Addressable through packaging engineering, carrier selection, and fragile-item handling protocols.
- Bracketing (ordered multiple sizes to return most) — 9% of returns by citation, though bracketing is widely believed to be under-reported as a stated reason. NRF data suggests close to two-thirds of consumers have engaged in at least one costly return behaviour including bracketing.
The critical reframe for prioritisation: reasons 2 and 4 (wrong item; damage) are fulfilment and packaging problems with operational fixes. Reason 1 (changed mind) is partially addressable through policy. Reasons 3 and 5 (expectation gap; bracketing) are where most returns reduction programmes should concentrate, because they are most directly connected to product content and purchase intent signals.
For apparel specifically, fit and sizing issues account for approximately 45–53% of returns — larger than the general consumer survey figures suggest because apparel shoppers often cite "changed mind" or "wrong item" when the real reason is a fit issue they did not feel comfortable attributing to a sizing problem. This makes the fit and sizing intervention the highest-priority investment for any apparel or footwear brand.
The ROI Maths: What a Reduction Is Worth
Build the financial case before selecting tactics. The calculation has two components: retained revenue and avoided processing cost.
The processing cost variable is where most calculations go wrong. A $100 apparel item returned costs the retailer $20–$65 in total all-in reverse logistics cost (Bold Metrics 2026 range) — not the carrier label cost alone. Include: return shipping, inspection labour, repackaging, restocking or liquidation write-down (items that cannot be resold as new), and the inventory carrying cost of stock in transit. A meaningful share of returned items — those with tags removed, worn, or damaged — cannot be resold at full price. This markdown cost is often the largest single component of return processing cost for apparel and footwear brands, and it is consistently excluded from simple "shipping cost + labour" estimates.
Eight Reduction Tactics: Evidence, ROI, and Priority
Pre-purchase interventions (the highest-ROI tier)
Pre-purchase interventions prevent the return before an order is placed. Because they operate upstream of all fulfilment, packaging, and reverse logistics cost, they have the highest ROI of any returns reduction investment. The fundamental principle: if a customer knows they are selecting the right size, colour, or product before clicking "buy," the return rate drops — without any change to your product, your packaging, or your returns process.
Size charts with measurements, model-specific fit annotations ("this model is 5'9" and wears a size 10"), and "runs small/large" descriptors are the single cheapest, fastest, highest-reach intervention available to any apparel or footwear brand. They apply to every SKU. They require no technology integration. And they directly attack the single largest return cause for these categories.
What a good size guide includes: body measurement instructions (not garment measurements — how to measure yourself, with illustrated diagrams); a garment measurement table (actual garment dimensions, not just the size label); the model's measurements and which size they are wearing; brand-specific fit notes (slim cut; relaxed fit; cut short in the torso); and user-generated fit feedback aggregated from reviews ("62% of reviewers say this runs large").
What most size guides miss: width data for footwear (standard, wide, narrow), stretch percentage for knitwear, and the specific measurements most likely to cause a fit failure for that garment type (rise for trousers; chest width for structured jackets; sleeve length for knitwear). The brands with the lowest return rates in their categories have completed this work per-SKU, not at the category level.
AI fit tools take a shopper's measurements (or body profile) and predict the size most likely to fit correctly based on the garment's specific construction, not just the brand's general size chart. The key improvement over static charts: they account for brand-to-brand sizing variation, garment-specific cut and fit characteristics, and the shopper's individual body shape rather than generic category averages.
The most credible published evidence: a 2024 peer-reviewed study across 120,000 shoppers and six European retailers found a 22% average reduction in size-related returns from AI size predictors — but only for customers who completed all required inputs. (DigitalApplied, May 2026, citing the academic study.) Industry vendor aggregates typically cite 27–30% reduction figures; the academic figure is the more conservative and credible anchor for business case modelling. Vendor-reported case studies with named brands are stronger than aggregated claims: Andie Swim reported a 30% return rate reduction after achieving 40% tool adoption in 2024 (Looksy, January 2026).
Leading platforms in 2026: Bold Metrics, Fit Analytics (now part of Snap), Measmerize (NRF Big Show 2025 top 50 innovation), Sizebay. Integration complexity varies — most offer Shopify apps or API integration with major ecommerce platforms. Pricing models range from flat monthly fees to per-recommendation pricing.
22% of returns cite "item not as described or portrayed" as the reason. This is the most directly actionable return reason in the data: it means the product page communicated something materially different from what the customer received. The fix is a systematic expectation gap audit — cross-referencing return reasons against specific product pages and identifying where descriptions over-promise, photography misrepresents colour or scale, or specifications are incomplete or inaccurate.
The audit process: pull return reason data at SKU level; filter for "not as described" or "wrong colour/material" reasons; identify the 20% of SKUs generating 80% of expectation-gap returns; review those product pages for the specific gap (colour accuracy in primary photography, material description, dimensions for home goods, compatibility for electronics); remediate. A targeted SKU-level audit will almost always find that a small cluster of product pages is responsible for a disproportionate share of expectation-gap returns — because the issue tends to be systematic within a category or photography batch, not randomly distributed.
Colour accuracy is specifically worth addressing: colour variation between photography lighting and actual product colour is one of the most common and most correctable causes of returns. Shooting against a neutral background under consistent lighting, and including close-up material texture shots, directly addresses the expectation gap for colour and material returns.
For categories where scale, dimension, and spatial context drive the purchase decision — furniture, home goods, large format décor — standard photography cannot convey what the product will look like in the buyer's actual space. 3D product viewers (which allow rotation and inspection from all angles) and AR visualisation (which places the product in the buyer's room using their phone camera) directly address this gap.
Shopify data cited by VNTANA (May 2026) indicates products with 3D interactive content reduce returns by up to 40% and increase conversion by up to 94%. These are Shopify-sourced figures — treat as directional rather than independently verified. Zara's AR implementation is associated with a documented double-digit reduction in size-related returns (Articsledge, March 2026). The DigitalApplied 2026 returns playbook characterises 3D and AR as "most valuable for furniture, home, and complex products where appearance and scale drive returns; less essential for low-return categories."
The ROI maths for furniture specifically: a $400 chair returned costs $50–$80 in reverse logistics. The alternative — a material swatch sample ($7) that filters out buyers who would have returned — is less than the processing cost of one return. The swatch programme pays for itself with the first converted-or-filtered buyer per style.
Electronics return rates (8–15%) are lower than apparel, but the cost per return is often higher because items are more expensive and harder to resell as "new" after opening. The primary driver is compatibility mismatch: a cable bought for the wrong port, a case bought for the wrong phone model, software that does not support the buyer's operating system. These are not preference failures — they are information failures. The buyer did not have the right information at purchase time.
The intervention: structured compatibility data on the product page (not buried in a spec table — prominently displayed, cross-referenced to the buyer's device or use case), a compatibility checker tool that lets buyers input their device details to confirm compatibility before purchase, and a clear specification table with every dimension, connection type, power requirement, and compatibility range that a buyer would need to make a confident decision. For accessories and peripherals, a "check compatibility" button that asks the buyer for their device model and returns a clear yes/no is one of the highest-ROI interventions available for this category at minimal development cost.
Post-purchase interventions (reduce cost; retain revenue)
Post-purchase interventions do not prevent the return — they either reduce the processing cost when a return does happen, or recover revenue from the return event that would otherwise be lost.
An exchange-first return flow presents the customer with an exchange or store credit option before a refund option — and makes the exchange easier, faster, and more rewarding than the refund. When a customer returns a garment because it is the wrong size, they almost always want the correct size — the product itself was not the problem. An exchange flow that automatically identifies the most likely alternative (the size up, or a different width), offers instant store credit, and completes the exchange in two clicks captures revenue that a standard refund flow loses.
The commercial mechanism: refunds return money to the customer and end the transaction. Exchanges retain the revenue within the business and may generate an incremental order (the exchange item plus an additional purchase made while the customer is in the return portal). Loop Returns data (cited by Digital Commerce 360, November 2025) characterises exchange-first as the "returns evolution" for 2025: as shoppers become more comfortable with digital returns portals, exchange conversion rates have improved significantly.
Implementation: return management platforms including Loop Returns, AfterShip Returns, and Narvar handle exchange-first flow design. Shopify has native return and exchange management. The key design principle: make the path to exchange shorter and more immediately rewarding than the path to a refund. An "instant exchange" option where the replacement ships immediately (before the return arrives) converts at higher rates than a "wait for return processing" exchange — because the customer gets the right product faster.
The distribution of returns across a customer base is highly skewed. A small percentage of customers — typically 5–10% — account for a disproportionate share of return volume. These serial returners may be engaging in habitual bracketing, wardrobing (buying, wearing once, and returning), or straightforward return fraud. Treating all customers identically in return policy — offering the same free, no-questions returns to both a 0% return-rate customer and a 70% return-rate customer — subsidises the high-returner cohort with the margin generated by the broader customer base.
Differentiated policy approaches: tiered return windows (loyalty members get 60 days; standard customers get 30 days; identified high-returners get 14 days or restocking fees); return restrictions for customers whose return rate exceeds a defined threshold (Amazon and H&M both use account-level return monitoring); and "final sale" designation for specific SKUs or customer accounts where the cost-per-return exceeds the margin benefit of offering free returns. 85% of retailers already deploy AI to detect return fraud (NRF 2025) — the tools exist; the question is whether the policy is in place to act on the signals.
The customer communication risk: notifying a customer that their return privileges are restricted is a customer service minefield. The best-practice approach is to restrict proactively (shorter windows, restocking fees for high-returners) rather than account-blocking, which triggers complaints and social media amplification. Be specific about what the policy is and communicate it clearly in the returns section of the product page and checkout flow.
23% of returns are attributed to receiving the wrong item — the second most common return reason. This is an operations failure, not a product or content failure. No amount of product page improvement or AI fit tool will fix a pick-and-pack accuracy problem. The fix is in the warehouse: barcode scanning at pick (to verify the correct SKU is picked before it is packed), packing confirmation (a second scan or visual check at pack), and order accuracy tracking as a warehouse KPI.
Pick accuracy targets in well-run fulfilment operations are typically 99.5–99.9%. If your "wrong item received" return rate implies a pick accuracy rate below 99%, the fulfilment operation needs attention before any other returns reduction initiative. This is because wrong-item returns have a double cost: the return shipping and processing cost, plus the fulfilment cost of the replacement order that the customer expects.
Technology interventions for accuracy: barcode scanning at every pick station (eliminates the human visual recognition failure that causes most wrong-item picks); pick-to-light or voice picking for high-SKU-count operations; post-pack weight verification (each packed order is weighed; an unexpected weight triggers a manual check before the label is applied). These are established warehouse management capabilities — not emerging technology — and they pay for themselves quickly at meaningful order volumes.
Return Policy Design: The Business Trade-Off
Return policy is one of the most debated topics in ecommerce operations because it directly connects the customer experience to the P&L. The trade-offs are real and the right answer depends on your customer base, margin profile, and average order value.
The free returns dilemma
Offering free returns increases return volume. Customers who know they can return at no cost are more willing to order products they are uncertain about — and more willing to bracket (order multiple sizes with intent to return most). Free returns did not create the 19% ecommerce return rate, but they have normalised return behaviour as a feature of the shopping experience rather than an exception.
At the same time: 82% of consumers cite free returns as a major purchase consideration (NRF 2025, up from 76% in 2024); 46% say they abandon purchases if return methods are not convenient; and 71% say they are less likely to shop with a retailer again after a poor return experience. Restricting free returns risks conversion rate losses that exceed the returns processing cost savings. The calculation is brand-specific and depends on your customers' price sensitivity and loyalty.
The emerging middle ground is conditional free returns: free returns for exchanges and store credit; paid returns for cash refunds. This model — adopted by ASOS, Zara, and a growing number of DTC brands — steers customers toward the exchange (revenue-retaining) outcome without eliminating the return option entirely. The data point that supports it: 76% of consumers say they are more likely to choose a return option featuring instant refunds or exchanges (NRF 2025), which means exchange-qualified free returns satisfy the majority of customers who value return convenience.
The return window decision
Longer return windows reduce "changed mind" returns — customers have more time to decide, reducing the impulse return that happens when a customer panics about a purchase they are uncertain about. Counterintuitively, studies in behavioural economics consistently find that longer return windows reduce return volume relative to shorter windows. The mechanism is the "endowment effect": the longer a customer owns an item, the more they feel it is theirs, and the less likely they are to return it. A 90-day return window tends to produce lower actual return volume than a 14-day window for the same customer base and product range.
The exception: categories with seasonal or occasion use cases (formalwear, holiday decorations, sporting goods used for a specific event). A 90-day return window for a wedding guest dress creates a direct wardrobing pathway. For these categories, shorter windows and "worn/altered" exclusions are commercially defensible.
Building Your Returns Reduction Roadmap
Given the eight tactics and the policy decisions above, the practical sequencing for an Ops Lead building a returns reduction programme:
Week 1–2: Run a SKU-level returns audit. Identify the 20% of SKUs generating 80% of your returns. For each, pull the return reasons. This single step tells you where to invest and in what order.
Month 1: Fix the fulfilment accuracy problem if wrong-item returns are above 3% of total orders. Review and improve size guide quality on the top-returning apparel and footwear SKUs. Update product descriptions for identified expectation-gap SKUs. All three are low-cost, high-impact, and can be executed without technology procurement.
Month 2–3: Implement an exchange-first return flow. Evaluate and trial an AI size recommendation tool on your highest-returning apparel category (trial with one category before full rollout to measure impact clearly). Consider the conditional free returns model if your current free returns policy is driving a return rate meaningfully above your category average.
Month 3–6: Build serial-returner identification into your CRM using your return rate data per customer. Implement 3D content for your top-returning furniture or home goods SKUs if relevant. Configure AI-powered return fraud detection if you are seeing volume above 5% of returns attributable to fraud signals.
Ongoing: Establish return rate by SKU as a routine reporting metric reviewed monthly, alongside return reason distributions and return rate trend by category. Returns reduction is not a one-time project — it is a continuous improvement discipline that requires the same data infrastructure attention as conversion rate optimisation.
Our ecommerce fulfilment and operations practice works with brands on both the data infrastructure and the operational interventions described in this guide — from SKU-level returns auditing to AI catalogue enrichment that reduces expectation-gap returns at scale.
Limitations of This Guide
- All headline return rate statistics are from the NRF / Happy Returns 2025 Retail Returns Landscape (October 2025), the most current industry benchmark available. The NRF's next annual report is expected late 2026 — verify at nrf.com/research/2025-retail-returns-landscape for any updated figures before using in board-level presentations.
- The AI size predictor "22% reduction" figure is from a 2024 peer-reviewed study cited by DigitalApplied (May 2026). MercuryMinds has not independently accessed the primary study to verify methodology. Use as the most credible published academic anchor; run your own controlled measurement before committing to a business case based on this figure.
- The Shopify "up to 40% return reduction from 3D content" is Shopify-sourced data cited by VNTANA (a 3D content vendor). Both are commercially motivated; treat as a directional maximum, not a guaranteed average.
- Category return rate ranges reflect consensus across multiple 2025–2026 sources. Your actual category rate depends on your specific price point, customer base geography, and product mix. Do not use these ranges as substitutes for your own transaction-level data.
- Return fraud statistics (9% of all returns fraudulent; Appriss/Deloitte: ~15% of return volume) come from different methodologies and definitions. The NRF figure (9%) reflects retailer-identified fraud; the Appriss/Deloitte figure includes policy abuse (returns of worn items, bracket returns) that does not meet legal definitions of fraud. Be precise about which definition you are using when presenting these figures internally.
Running a returns rate above your category benchmark and not sure why?
MercuryMinds builds the data and operational infrastructure that makes returns reduction measurable — SKU-level audits, AI catalogue enrichment for expectation-gap SKUs, and fulfilment process improvement. We work across Shopify, WooCommerce, and custom ecommerce environments.
Talk to the TeamFrequently Asked Questions
What is the average ecommerce return rate in 2026?
The average ecommerce return rate is approximately 19 to 20 percent heading into 2026, based on the National Retail Federation and Happy Returns 2025 Retail Returns Landscape report (October 2025), which put the 2025 ecommerce rate at 19.3 percent — down slightly from around 20.5 percent the year before. Overall retail returns (including in-store) were 15.8 percent in 2025, totalling $849.9 billion. Ecommerce returns run higher than in-store because shoppers cannot physically inspect, try on, or assess products before purchasing. Return rates vary significantly by category: apparel typically runs 20 to 40 percent, footwear 17 to 30 percent, electronics 8 to 15 percent, and beauty 4 to 12 percent.
What are the main reasons customers return ecommerce orders?
The main reasons customers return online purchases are: changed their mind after purchase (24 percent), received the wrong item (23 percent), item was not as described or portrayed online (22 percent), received a damaged or defective item (20 percent), and bracketing — ordering multiple sizes or variants with the intention of returning some (9 percent by stated reason, though significantly under-reported). For apparel specifically, fit and sizing issues account for approximately 45 to 53 percent of returns — the single largest category of avoidable returns.
How much do ecommerce returns cost retailers?
Processing a returned item typically costs 20 to 65 percent of the item's original sale price for fashion and apparel retailers (Bold Metrics, 2026). Direct costs include return shipping, inspection, repackaging, and restocking labour. Indirect costs include lost margin on discounted resale of items that cannot be resold as new, inventory carrying costs, and customer relationship impact. For a $100 garment, the all-in return processing cost can reach $20 to $65. A 5-percentage-point reduction in return rate on a $10 million annual revenue business is worth approximately $650,000 to $700,000 per year in retained revenue and avoided processing costs.
How effective are AI size recommendation tools at reducing returns?
A 2024 peer-reviewed study across 120,000 shoppers and six European retailers found a 22 percent average reduction in size-related returns from AI size predictor tools, but only for customers who completed all required inputs (cited by DigitalApplied, May 2026). Industry vendor aggregates typically cite 27 to 30 percent reduction figures; the academic figure of 22 percent is the more conservative and credible anchor for business case modelling. Vendor-reported case studies show wider ranges: Andie Swim reported a 30 percent return rate reduction after achieving 40 percent adoption of their AI fit tool in 2024. Shopify data indicates products with 3D interactive content reduce returns by up to 40 percent, though this is a Shopify-sourced figure and should be treated as directional.
Should you offer free returns to reduce overall return volume?
Offering free returns increases return volume by making it easier for customers to return. However, it also increases purchase conversion. 82 percent of consumers cite free returns as a major purchase consideration, and 46 percent say they abandon purchases if return methods are not convenient. For most ecommerce businesses, the conversion lift from free returns outweighs the return cost increase — but this depends on your margin and average order value. The emerging middle ground is conditional free returns: free for exchanges and store credit, paid for cash refunds. This model retains the conversion benefit of "free returns" while steering customers toward the exchange (revenue-retaining) outcome rather than a full refund.